The
Recent La Niña
Winter of 2010/2011
COLD . . . .
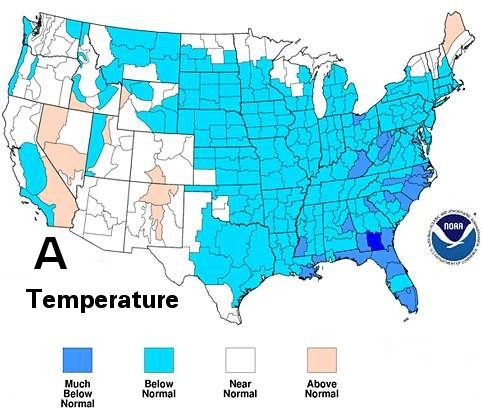
The United States, east of the Rockies, endured a
remarkably cold winter (Dec. 2010Feb. 2011), with most
states and counties reporting colder than normal conditions
(blue tones on map A, at right.
Only two statesNevada and Mainereported above-average
temperatures. Georgia (at 3.9°F below normal) and Florida
reported the greatest departures from their average winter
temperatures. The averages are for the 19702000 period.
In the western states, the month of February was unusually
cold, and several cities in California and Montana reported
their coldest February temperatures in over 30 years. Early
in the month, extreme cold descended upon the US-Mexico
border; El Paso, Texas reported that 15,000 pipes froze
and broke, causing $50 million in damages.
The atmospheric
circulation was active over the lower 48 states of the US,
with numerous waves in the jet stream, and strong low-pressure
centers causing intense snowstorms and outbreaks of cold
Arctic air behind them. The jet stream moved west-to-east
over the midsection of the country or somewhat farther north.
Snow cover attained its greatest extent, 71 percent of the
nation, by January 12, and on February 10, all states except
Florida reported some snow. For North America, the extent
of snow cover was the 8th largest for the month of February
in the 45-year record.
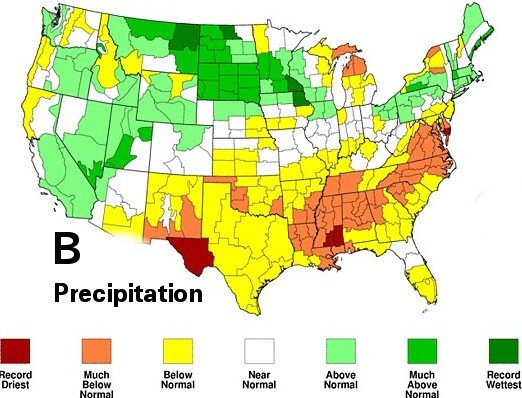
& DRY . . . . . The
active storm track over the middle of the United States
divided the country into wet and dry halves. The precipitation
pattern evident on map B at center
right is how La Niña typically manifests itself in
the winter in the United Stateswet in the north, quite
dry along the Gulf Coast. To the south of the storm track,
where yellow and orange predominate, the winter was the
third driest on record for the South climatic region, and
the ninth driest for the Southeast region. Dry conditions
were very pronounced in Louisiana, Mississippi, Alabama,
and North Carolina.
The winter was
wet and snowy for the North Central region (green on the
same map), underneath and north of the active storm track.
For December-to-February, South Dakota experienced its fourth
wettest period on record; Montana, its ninth.
INFLUENCE of LA NIÑA
& OTHER PATTERNS
La Niña has a strong influence
on the lower 48 U.S. states during the winter months. it
tends to bring dry conditions to the southern tier of states
from the Southwest to the Southeast, and wet conditions
to the Ohio Valley and the northern tier of states. It also
is associated with warmer-than-normal temperatures over
most of the US, something NOT seen in the past winter. Another
constant pattern this winter was a broad ridge ver the far
West, and a broad trough East of the Mississippi. This pattern
tends to be dry for most of the country, except on the West
coast which tends to be wet. It also tends to be cold near
the trough, which was true this winter. For the full story
we must look at other climate oscillations; in each month
a different oscillation had a stronger influence.
In December,
the Arctic Oscillation was strongly negative. That reinforced
dry conditions in the southeast and much below-normal temperatures
in the US east of the Rockies.
With the
broad ridge in the far Western states, a "pineapple express"
of airborne moisture lashed the Pacific coast with relentless
rainfall, in December.
In January, the
Pacific-North America (PNA) pattern was positive, which
is associated with a colder-than-normal Southeast and a
warmer-than-normal West coast. Both of these indeed happened.
The Mississippi valley and the East also tend to be dry
in a positive PNA pattern, and indeed they were dry.
By mid-February,
the PNA pattern flipped and became negative. The Southeast,
which had been unusually chilly, rather suddenly warmed
up. The Pacific Northwest cooled down. Wet and often snowy
conditions were the rule in the Ohio Valley, Great Lakes,
and the northern High Plains. The combined influence of
La Niña and the negative PNA favored some record-breaking
snowstorms in these regions, and caused the "Lower 48" to
have above-average snow cover in February.
This winter was
a great example of a curious climatic factoid: a region
can be drier than normal and yet have well-above-normal
snow cover, as long as its temperatures are below normal.
A lot of snow 9 inches, say, melts down into not much
water: 0.9 inch, often less. Where both rain and snow fall
during a typical winter, the rain contributes the most to
the seasonal precipitation total, the snow contributes lessbut
it is the snow that is remembered.